Latinos make up the largest minority group in the US, accounting for nearly 15% of eligible voters. They are also one of the fastest-expanding electoral forces – first-time Latino voters account for half of the growth in US eligible voters since 2020.
Historically, Latinos have leaned Democrat – a Republican presidential candidate has never won the Latino vote. The closest any GOP candidate has come was George W. Bush, who took 40%.
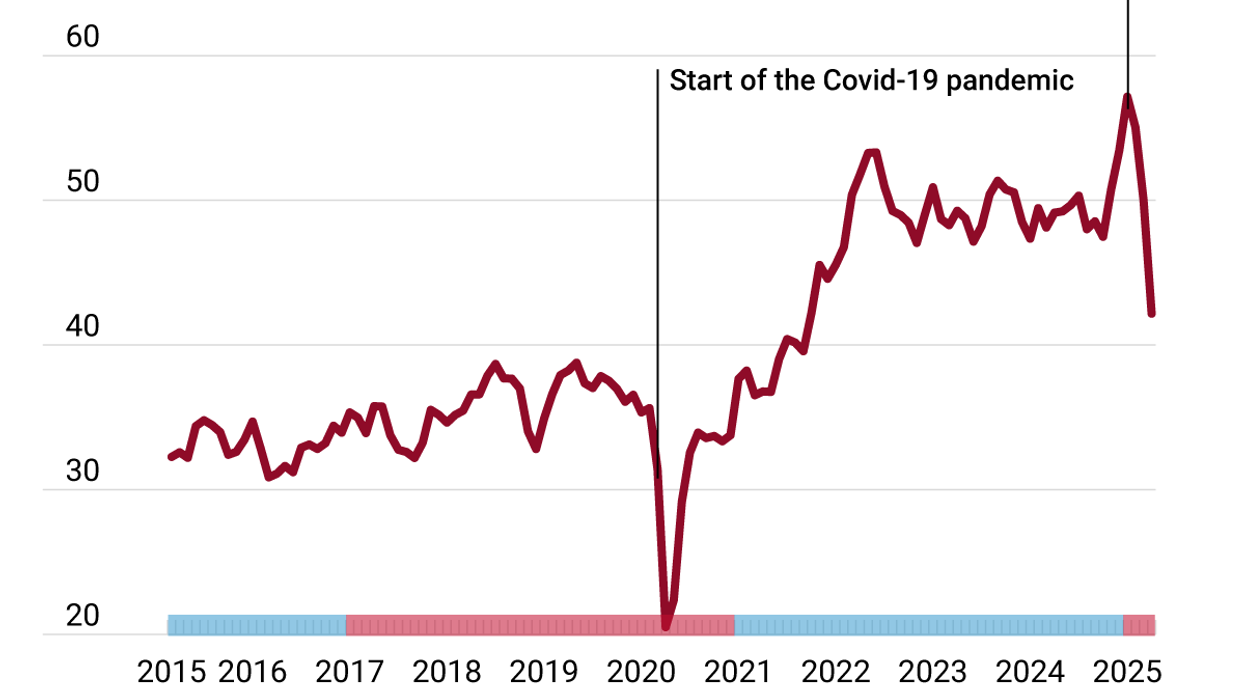
But over the past several election cycles, Latino support for the GOP has been rising. Former President Donald Trump currently polls at 39% among Latinos. If that holds through Election Day, it would represent an 11-point Trumpward swing since he ran for president in 2016. Here is a look at how Latinos have voted in every US presidential election since 1980, along with their share of the electorate in each year.


